The Quantitative Risk Assessment (QRA) aims to identify potential hazards, assess their likelihood, and evaluate the consequences of their occurrence and summarize this into a risk number.
As the name suggests, this quantitative methodology enables businesses to implement effective risk mitigation strategies by employing a variety of techniques. These techniques can then be fed into your process safety, from the design and operation of your facilities to your emergency response planning and regulatory compliance tactics.
In this short blog, we’ll discuss the basics of the Quantitative Risk Assessment and how you can use it as an effective risk assessment for your plant.
Data Collection and Hazard Identification
When partnering with Sigma-HSE, our first step is usually a site visit. At this stage, our consultants lay the groundwork by gathering data on your plant and processes. Typically, we gather details on your materials, processing methods, building occupancy, possible ignition sources, and other environmental conditions such as temperature, pressure, and flow rate.
After the site visit a couple options can be used to determine the possible scenarios, a Hazard Identification (HAZID) study, or an alternative form of Process Hazard Analysis, (HAZOP or Checklist). A review of your Piping and Instrumentation Diagrams (P&IDs) is usually undertaken, and numerous hazardous scenarios are generated. These scenarios will stem from various deviations from your design intent and will provide insights into potential risks and their consequences. This can include frequency and consequence analysis, which are factors that help to determine risk in a QRA.
QRA is also a fundamental component of the Safety Report required under COMAH 2015 for upper-tier sites, providing the quantified evidence that major accident risks have been reduced to as low as reasonably practicable (ALARP).
The methodology you use is dependent on the scale of your process risk.
By assigning numerical values to your parameters, you will then be able to quantify risk and provide a better understanding of potential harm to individuals and the environment. This, for example, could be radiation levels or specific chemical concentrations.
With the data collected on consequences, frequency, and overall risk, the next stage is to calculate what we define as ‘key metrics’ – individual and societal risk, e.g. Location-Specific Individual Risk (LSIR) and Potential Loss of Life (PLL). These metrics will then serve as a benchmark to later evaluate your risk exposure.
Frequency Estimation
After the data on potential consequence, an important part of the risk assessment (probability or frequency of experiencing the release and subsequent harm) must be calculated.
A scenario when calculating the consequences of a 10mm hole in a pipeline, for example, would include how frequently such a hole might occur.
To begin, a parts count is conducted, whereby the number of components, valves, and pieces of fixed equipment in each isolated section are calculated. This is then compared with a base frequency sheet, (readily available from several agencies in the UK), which provides release frequencies for different leak sizes and equipment types. Essentially, the more components present, the higher the likelihood of a release due to increased opportunities.
Likelihood of Risk Estimation
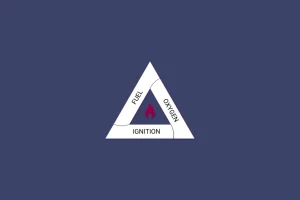
The likelihood of specific consequences resulting from a release is then evaluated. If, for example, a flammable liquid is released and promptly controlled by an operator, it may result in a minor in-house incident. If left uncontrolled, ignition may occur, leading to potential pool fires or explosions.
Again, determining these probabilities is highly dependent on operational factors such as ignition control measures, material properties, operator proximity, and the effectiveness of your control systems. By customising the likelihood of various outcomes based on operational circumstances, the most probable consequence can be ascertained.
Considerations should include the configuration of your plant, the inventory of equipment and fittings, automation capabilities for isolation, and factors like weather conditions and time of day. The presence and proximity of individuals who could potentially be harmed should also be accounted for, which again, ties back to the metrics discussed earlier i.e., LSIR or the probability of fatality.
Event Trees
Event trees play a role in systematically and graphically mapping out the potential outcomes of initiating events, by linking these events and their sequences to their probabilities through a frequency analysis, the event tree will aid in quantifying the likelihood of accident scenarios.
 1")
A potential type of release can potentially be incorporated into your model before a frequency analysis to determine the most probable impact of a loss of containment.
An example of a continuous release could be a jet fire. If ignition doesn’t occur immediately, there could be the potential for a vapour cloud explosion after a certain period. If ignition is delayed, however, the situation may not escalate significantly. But at this point, however, the toxic properties of the gas must be considered.
Similar considerations will also apply to instantaneous releases. The likelihood of each outcome will depend on material properties and the presence of potential ignition sources nearby. This can be identified through risk assessments like a DSEAR (Dangerous Substances and Explosive Atmospheres Regulations).
Individual Risk Analysis
Risk to an individual must be undertaken when estimating risk to your plant and process.
Individual risk refers to the risk experienced by a hypothetical person at a specific location, and it doesn’t necessarily have to be the same person each time.
If, for instance, multiple individuals occupy a particular location but are relieved by others, they collectively count as a single hypothetical person. The individual risk analyses the location and its associated consequences.
These measures are then expressed annually, allowing an alignment with tolerability criteria—how frequently an event must occur before legal repercussions or serious consequences ensue.
Societal Risk Analysis
Another part of your risk assessment is the societal risk, or the risk to the overall population, inside and outside the facility. Those may have different criteria depending on the area or country. Those are normally done based on Frequency vs Number of Fatalities (FN) curves and/or Potential Loss of Life (PLL).
Quantitative risk analysis & summation
In the real world, achieving zero risk is unattainable. Hence, what’s termed the “tolerability of risk” concept must be relied upon.
When considering risk, the question isn’t about what is acceptable and what isn’t—it’s about acknowledging that nothing should be deemed acceptable.

Typically depicted in orange (hence the term “carrot”), the tolerability of risk carrot above is a concept that we have categorized into red, yellow, and green zones. At the top are activities associated with the highest risk, while those at the bottom pose the lowest risk. If, upon calculation, the individual risk for a worker fatality exceeds 10 to the minus 3, or one in a thousand, it falls into the intolerable region.
Consequently, measures must be implemented to reduce this particular risk, initially moving it to the yellow region and ideally to the green region, where the risk for a single fatality is defined at 10 to the minus 6, or one in a million.
With just three orders of magnitude between these regions, quantitative risk assessments can prove superior to semi-quantitative methods. Semi-quantitative approaches operate in orders of magnitude, which can easily lead to arguments favouring either the intolerable or broadly acceptable region, given the minimal gap between the red and green zones.
Moving Towards Minimal Risk
Most of the time, achieving zero risk is unattainable, but a QRA will help you move towards minimising overall risk.
Apart from being an effective Process Hazard Analysis (PHA) tool, the QRA can also contribute to effective process safety management by providing appropriate training for personnel, emergency response planning (by identifying where injuries are most likely to occur) and clear risk communication with the public (which is a legal requirement for several country regulations, e.g. COMAH (Control of Major Accident Hazards) sites in the UK).
In cases where there are potential for major accidents, regulators will often require some form of a QRA to demonstrate to stakeholders, customers, suppliers, and the public, that you are complying with regulations and that you fully understand your hazards and risk.