
How to Build a Basis of Safety That Survives Scale-Up
Date Published:
Reviewed by:
Luke Bucktrout
TL;DR
A defensible basis of safety takes three testing methods run in sequence: thermal screening, reaction calorimetry, and adiabatic calorimetry, because the hazards that stay hidden at bench scale are the ones that run away at plant scale.
Should you consider a full chemical process evaluation?
Ask yourself these questions. If you answered no to any of them, you have a gap between compliant and safe worth closing before scale-up:
Does your basis of safety rest on more than one test method, rather than a single screen with a safety factor bolted on?
Do you know your MTSR, and whether it is high enough to trigger a secondary reaction or decomposition?
Do you have real adiabatic data (TMR and TD24) telling you how long you would have to intervene before a runaway reaches its peak rate?
Are the numbers going into your regulatory submission backed by ISO 17025 accredited testing?
A DSC trace can look completely benign and still be the most dangerous thing on your bench. Clean baseline, a tidy melting endotherm, an exotherm sitting so far up the temperature scale nobody would lose sleep over it at process conditions. On paper, a well-behaved material. The same chemistry, a few milligrams in a crucible one day and a few hundred kilograms in a reactor the next, is exactly where processes run away and people get hurt.
At small scale, the bench flatters your chemistry, and we see the consequences of that constantly. A few milligrams sitting in a metal crucible has a huge surface-area-to-volume ratio, so heat leaks away almost as fast as the reaction makes it. The crucible acts as a heat sink. Scale that same reaction up and the ratio inverts. The vessel can no longer shed heat fast enough, so you approach a near-adiabatic system where every joule the reaction releases goes into heating the reactor contents. The exotherm your screen shrugged at is the exotherm that runs away in the plant.
So when a single test tells you a material is fine, treat it the way you’d treat a single eyewitness. It’s a lead. It’s not a conviction.
Process Safety Insight
A material that passes a screen isn’t a safe process. It’s a material that passed a screen.
That distinction is the whole reason a complete chemical process evaluation takes three testing methods, not one. Thermal screening, reaction calorimetry, and adiabatic calorimetry each answer a different question, and you need all three, in sequence, before anyone can put their name to a basis of safety. Each one tells you something the other two can’t, and each one has a blind spot.
Thermal screening casts the net and cries wolf
Screening is where we start, because it is cheap, fast, and needs almost no material. A DSC (differential scanning calorimetry) run needs 5 to 10 mg. Instruments like the Thermal Screening Unit, Carius tube, or Calvet C80 take up to a few grams. For a novel process with barely any material to spare, that is the point of entry. You can screen raw materials, reaction mixtures, intermediates, and final products, run comparative studies across different solvents and temperatures. You can also pull out physical data you will need later, such as specific heat capacity (Cp), melting and boiling points, glass transitions, and gas generation data from decompositions. Run it early enough and it also tells you whether a route is worth pursuing at all, which is the cheapest possible moment to find that out.
You even get qualitative insight into mechanism. A sharp, narrow exotherm on a DSC scan indicates an autocatalytic decomposition. A broad, slow one looks more like an nth-order reaction. That matters for how a runaway would develop.
Of these tools, the DSC is the one we run under ISO 17025 (UKAS) accreditation, to ASTM E537. That is easy to wave past in a feasibility study and hard to ignore in a regulatory submission, where an accredited onset is a good deal harder to challenge than an unaccredited one.
But screening buys its speed with conservatism. Because the sample is tiny and the heat losses are real, the honest output is narrow. There is an exotherm present, and here is its approximate onset. We then apply a safety factor of 80 to 100 °C to that onset, because we do not trust the number to be scalable. So screening will happily flag a dozen suspects and exaggerate every one of them.
Process Safety Insight
Screening tells you a hazard exists. It doesn’t tell you whether it matters at scale. Those are not the same question.
We will defend a stronger version of that. A DSC onset carrying a 100 °C safety factor is not a basis of safety. It is a placeholder for one, and treating it as the finished answer is the most common way scale-up safety can quietly go wrong. Design a process off screening data alone and you will do one of two things. You will over-engineer against phantom hazards, or, far worse, you will miss the pressure-driven event a temperature-only screen never saw. You need a second witness.
Reaction calorimetry tells you which hazard matters
Reaction calorimetry is where the picture gets scalable. Reactions are run under controlled temperature and pressure conditions with representative stirring and dosing, and the instrument measures reaction power via power compensated or heat flow calorimetry methods. Those conditions simulate what your reaction will do at scale, rather than what a milligram does in a crucible. Running it alongside thermal screening studies is most efficient, allowing you to sample representative mixtures for thermal analysis.
The outputs are the ones that drive process design. Reaction enthalpy gives you the adiabatic temperature rise, and from that the MTSR, the maximum temperature the synthesis reaction would reach if cooling failed and the reaction was enabled to runaway. Heat-generation rates show you the peak thermal load your cooling system has to handle, whilst accumulation potential tells you whether your dosing strategy is safe or whether you are stockpiling unreacted material for a later surprise.
And here is the move that changes how you spend your testing budget. Suppose screening flagged a material with a low-lying exotherm. On the safety-factored adjusted onset, it looks high risk. Then reaction calorimetry shows the MTSR sits below that safety-adjusted onset. The reaction can’t climb high enough to trigger it. You’ve demoted a hazard that screening told you to panic about, and freed the time to focus on a scenario that threatens the process. That is where the cost of the whole programme is won or lost. Adiabatic characterisation is the expensive, material-hungry end of the work, so every hazard you can rule out with a cheap screen and a calorimetry run is one you do not pay to fully characterise, and one that does not eat a slice of a deadline that will not move.
Process Safety Insight
Screening finds the suspects. Reaction calorimetry works out which one had the means. Prioritisation isn’t a shortcut. It’s the difference between testing what matters and testing everything.
By reading screening and calorimetry data together across every stage of the process, we can identify the point with the highest potential for thermal runaway, your worst credible scenario. And a process has to be designed to accommodate its worst credible scenario, not its average day.
We'll guide your Process Safety
Testing Strategy
Our consultancy team are on hand to discuss your requirements and provide actionable safety solutions.
Contact UsAdiabatic testing shows you the worst case, at real conditions
Once you know which scenario to worry about, you characterise it properly, and that means adiabatic calorimetry. This is the step that earns the word “scalable.”
The reason goes back to that surface-area-to-volume ratio problem. A bulk vessel is near adiabatic. Your test cell isn’t, because some of the reaction’s heat goes into warming the cell rather than the sample. We quantify that loss with the phi factor, the thermal inertia of the measurement. Bulk systems sit close to a phi factor of 1, so in instruments like the ARC, Phi-TEC I, VSP2, or ARSST, we can drive the phi factor down toward 1 using high sample-to-cell mass ratios and low-heat-capacity cells, replicating near-adiabatic conditions safely at lab scale.
Of these, the ARC is the method we hold under ISO 17025 (UKAS) accreditation, to ASTM E1981. That makes us the only laboratory in the UK accredited to ISO/IEC 17025 for both DSC and ARC. So the two numbers a regulator is most likely to lean on, the DSC onset at the screening end and the adiabatic characterisation from the ARC at the worst-case end, both come back as accredited results.
Process Safety Insight
A phi factor near 1 is the whole game. It’s the difference between data about your test cell and data about your process.
This is also where accurate Cp from your earlier screening pays off. It plugs straight into the adiabatic calculation. What comes out is the full picture of the worst case. You get the total exothermic energy release, the temperature and pressure profiles, and the rates of temperature and pressure rise that emergency relief system vent sizing depends on.
It also gives you the parameter that tells you how much time you actually have. The TMR (time to maximum rate) curve maps, for every starting temperature, how long the material would take to reach its maximum self-heating rate under adiabatic conditions. Read it at 24 hours and you get the TD24.
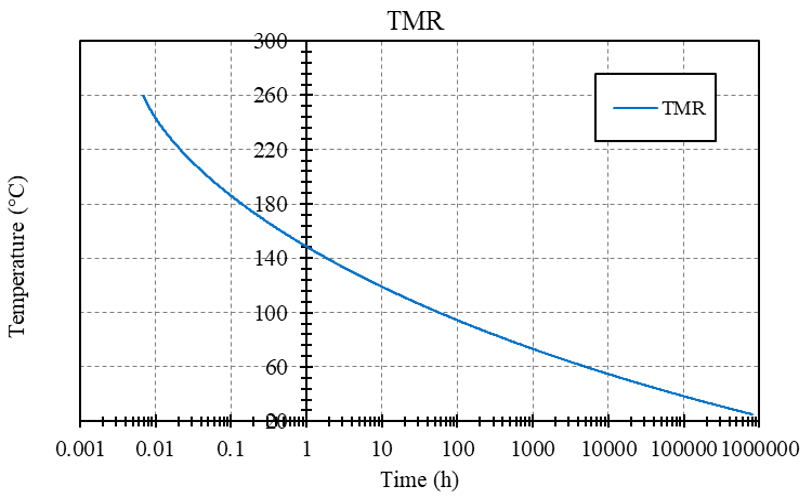
Time to maximum rate (TMR) under adiabatic conditions for a material characterised in our lab. At 24 hours the temperature (TD24) reads 109.2 °C. Source: Sigma-HSE ARC, ISO 17025 (UKAS) accredited to ASTM E1981.
Take that real result. A TD24 of 109.2 °C means that if you hold this material at 109 °C, the worst credible case gives you about a day before the runaway reaches its peak rate. Drop the temperature and that window opens up quickly. Let it climb and the window shrinks to hours, and then to almost nothing. That single number changes how you design the response: how much cooling margin you build in, how fast your interlocks have to act, and how long an operator realistically has to intervene. The SADT from the same run then governs whether the material can be transported and stored at all.
Integration is where you get a basis of safety
The three tie together, because the integration is the evaluation.
Reaction calorimetry gives you the cooling-failure picture. Follow it and you can see the adiabatic temperature rise and the MTSR that results. Screening data tells you whether that MTSR is high enough to trigger a secondary reaction or decomposition, and if it is, you’ve confirmed a credible worst case. Adiabatic testing then simulates that exact scenario to validate it and generate the scalable numbers that size your relief systems.
None of that data stays in the lab. It feeds the assessments your process safety colleagues run, such as DSEAR, HAC and dispersion modelling, PSM, HAZID and HAZOP, and LOPA. Testing, interpretation, and the assessment that turns numbers into a safe design all work better when they aren’t handed across three organisational boundaries. That is the practical case for keeping evaluation, consultancy, and training under one roof, which is how we run it. The data arrives already understood.
Run the other way and the arithmetic gets ugly. Skip the sequence and you either over-characterise everything to be safe, which is slow and expensive, or you find the gap at pilot after the process is locked and the regulatory studies are running, which is the most expensive place there is to find it. The integrated evaluation is not the thorough option instead of the cheap one. Sequenced properly, it is the cheap one.
Process Safety Insight
You don’t get a basis of safety from an instrument. You build it, the way you’d build a case, from more than one witness and enough hard data to stand up to scrutiny.
The question worth taking back to your bench
The next time a single test tells you a material is fine, ask a harder question. Fine, at what scale, and against which scenario? If your basis of safety rests on one method, you are either carrying an 80 to 100 °C safety factor you haven’t tested your way out of, or you are trusting a worst case you have never properly investigated.
Screen widely. Quantify what matters. Characterise the worst case under conditions that resemble your reactor. Three methods, in that order, because the process you are designing doesn’t care which test you ran. It only cares whether the data was scalable, and whether it holds up when someone downstream has to defend it.
If you’re building a safety package and you’re not sure where the gaps are, that is the conversation our CPE lab exists to have. Bring us the chemistry and the timeline, and we’ll tell you which tests are doing real work and which ones are only making you feel better.
On-Demand: Using Data to Avoid Catastrophic Failure of Your Chemical Process
Learn more about process safety testing in our FREE on-demand webinar.
Table of Contents
We'll guide your
Process Safety Strategy
Free Technical Consultation
Cross-Functional Support
Global PSM Support

Frequently asked questions
Is thermal screening enough to sign off my process as safe?
No. Screening carries an 80 to 100 °C safety factor and only tells you a hazard exists, not whether it matters at scale. A defensible basis of safety needs reaction calorimetry and adiabatic data on top of the screen.
When do I need adiabatic testing rather than just a DSC?
Once you have identified a credible worst-case scenario. Adiabatic calorimetry (ARC) reproduces near-bulk conditions at a phi factor close to 1 and gives you scalable numbers, such as TD24 and the full pressure profile, that a DSC screen cannot.
What does a TD24 value actually tell me?
TD24 is the temperature at which the time to maximum rate is 24 hours, so it tells you how long you would have to intervene before a runaway reaches its peak rate. That single number drives how much cooling margin you build in, how fast your interlocks must act, and how you size emergency relief.
What testing does Sigma-HSE provide for a full chemical process evaluation?
Thermal screening, reaction calorimetry, and adiabatic calorimetry, with DSC and ARC delivered under ISO 17025 (UKAS) accreditation as the only laboratory in the UK accredited for both.